Help
Input: Users can either enter a sequence or a set of sequences in the text box provided or upload a .txt or .fasta file containing sequences. The query sequence should be in FASTA format.
FASTA format begins with a greater-than ('>') symbol followed by a single-line description aslo called as identifier. The sequence data starts from the next line. The description line is demarked from the sequence data by a greater-than ('>') symbol in the first line.
For example:
>Antimicrobial peptide
WNPFKELERAGQRVRDAVISAAPAVATVGQAAAIARG
Note: The identifiers of the sequences should be different.
Output: The output is in two formats, a simple tabular format and a detailed result which can be seen on clicking the Show/Hide Details link.
Table contains information about the input sequence, AMP family and the number of patterns and HMMs which correspond to the input sequence.
For the input sequence:
>Antimicrobial_peptide
WNPFKELERAGQRVRDAVISAAPAVATVGQAAAIARG
Tabular results:
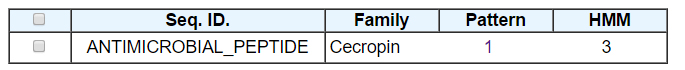
The input sequence belongs to the cecropin family. The number of patterns and HMMs present in the database that match to the input sequence are provided. Clicking on the number will take you to the detailed results.
Detailed results:
Detailed result for patterns:
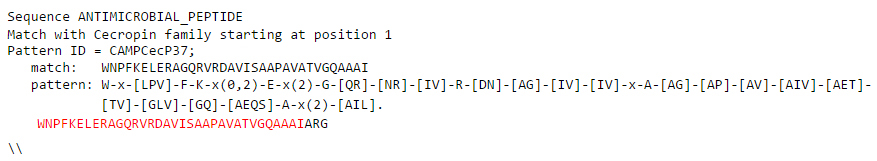
The first line is the sequence id, followed by information about the AMP family with which the input sequences matches and the position from where the match starts. The following lines contain information about the pattern id of the pattern that shows a match, the exact region that matches to the pattern and the pattern. Last line is the entire input sequence with the pattern matching region in red.
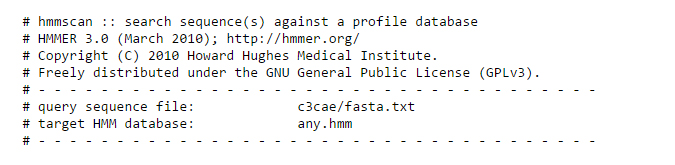
Detailed results for HMMs:
The first section is the header containing information about the program used, the input file and the database against which the input sequence is scanned.
The second section contains the hits list which is sorted by E-value.
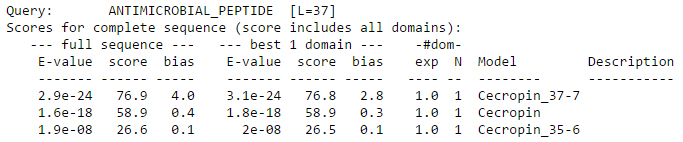
The first column represents the E-value for the complete sequence which is a measure of the statistical significance of the match, lower the E-value, more significant is the match. The second column is the bit score, which is log-odds score for the complete sequence. The next column is the bias, which is a correction term for biased sequence composition applied to the sequence bit score. The next three columns are again E-value, score, and bias for the single best-scoring domain in the sequence.
The next column exp is the expected number of domains according to HMMER’s statistical model. It’s an average, calculated as a weighted marginal sum over all possible alignments. The column N, is the number of domains that HMMER’s domain postprocessing and annotation pipeline finally identifies, annotates, and aligns in the target sequence. This is the number of alignments that show up in the domain report later in the output file. The column Model contains name of HMM with which the sequence matches and the last column is the description which is optional.
The next section contains domain annotation for each model along with the alignment.
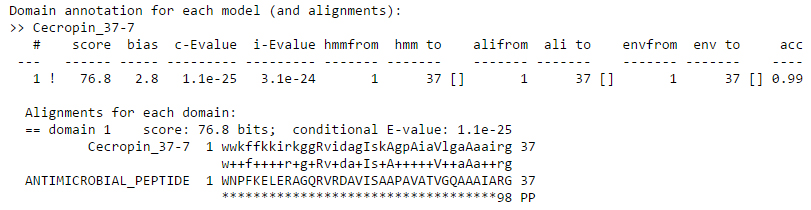
Domains are listed in the order they appear in the sequence, not in order of their significance. Here since there is a single domain. The ! or ? symbol indicates whether this domain does or does not satisfy both per-sequence and per-domain inclusion thresholds (E-value: 0.01). The bit score and bias values are same as described above for just one domain. The first E-value is the conditional E-value which a measure of the statistical significance of each domain. The second is the independent E-value which is a measure of the significance of the sequence in the whole database search.
The next four columns give the start and end of the reported local alignment with respect to both the query model (“hmm from” and “hmm to”) and the target sequence (“ali from” and “ali to”). The symbol .. means both ends of the alignment ended internally, and [] means both ends of the alignment were full-length to the ends of the query or target, and [. and .] mean only the left or right end was full length. The next two columns (“env from” and “env to”) define the envelope of the domain’s location on the target sequence. The envelope is almost always a little wider than what HMMER chooses to show as a reasonably confident alignment.
The last column ‘acc’ is the average posterior probability of the aligned target sequence residues; effectively, the expected accuracy per residue of the alignment.
Coming to the alignment, line starting with Cecropin_37-7 is the consensus of the HMM. Capital letters represent most conserved positions. Dots (.) in this line indicate insertions in the target sequence with respect to the model. The midline indicates matches between the query model and target sequence. A + indicates positive score, which can be interpreted as “conservative substitution”, with respect to what the model expects at that position.
The line starting with ANTIMICROBIAL_PEPTIDE is the target sequence. Dashes (-) in this line indicate deletions in the target sequence with respect to the model. The bottom line represents the posterior probability (essentially the expected accuracy) of each aligned residue. A 0 means 0-5%, 1 means 5-15%, and so on; 9 means 85-95%, and a * means 95-100% posterior probability. You can use these posterior probabilities to decide which parts of the alignment are well determined or not.
These domain table and per-domain alignment reports for each sequence then continue, for each sequence that was in the per-sequence top hits list.
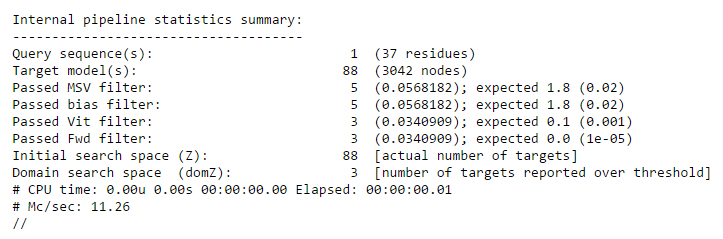
Finally, at the bottom of the file, a summary is provided which gives information about the query sequence, the target database, the scoring algorithms used, the search space sizes and the speed of the search.
Note: The Help for HMM results has been taken from HMMER user guide. For detailed information please go through the user guide. (ftp://selab.janelia.org/pub/software/hmmer/CURRENT/Userguide.pdf).
Users can also find AMPs homologous to their input sequence using the ‘Blast to AMP Databases’ button.
|